Comparison between Grey heron and Night heron flight calls
by Marco Dragonetti - Gruppo Ornitologico Maremmano
Following a discussion on Xeno-canto website about the identification of heron flight calls (see here), where the attribution to Night heron was questioned, I decided to compare spectrograms of the two species in order to be sure of the identification of the discussed call and to study the differences between these two similar vocalizations (Night heron and Grey heron flight calls).
Here below in Fig. 1 there are 9 spectrograms (and oscillograms) of flight calls sampled from 4 different Grey herons. Fig. 2 shows 8 samples from 3 different Night herons. Bird identification was certain in these cases because was performed by sight. Fig. 3 shows 9 samples of the discussed id call (see Xeno-canto XC54113).
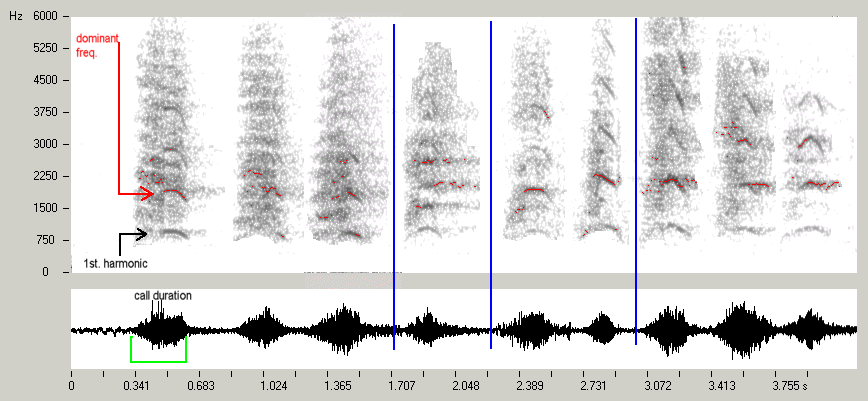 FIG. 1 - Nine flight calls sampled by four Grey herons
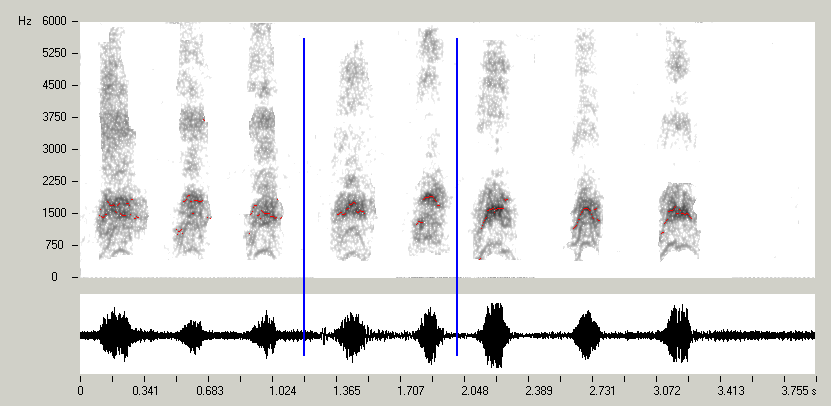 FIG. 2 - Eight flight calls sampled by three Night herons
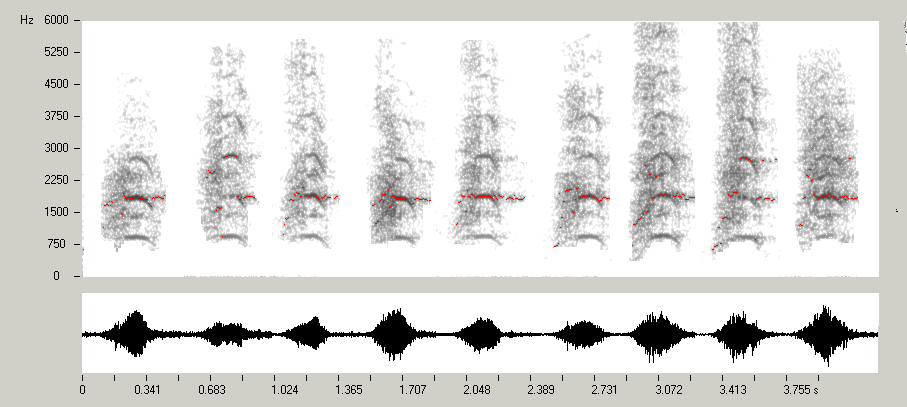 FIG. 3 - Nine flight calls sampled by the discussed id bird
Visual analysis of the spectrograms suggests that Grey heron flight call has a more complex structure characterized by several harmonic components, a higher dominant frequency and a higher first harmonic. Night heron calls have a less defined structure, with lower dominant frequency and a quite low harmonic component. The discussed id calls are clearly more similar to Grey heron calls than to Night heron calls.
For each call I have measured three parameters (see FIG. 1): the peak dominant frequency (that is the frequency associated with the maximal amplitude), the frequency of the first harmonic component, the duration of call. Table 1 below shows the results of these measurements that are expressed as mean values +/- Standard Deviation.
 TABLE 1 - Mean values +/- Standard Deviation of dominant frequency, first harmonic frequency and call duration.
Multivariate analysis of variance (MANOVA) was performed to assess overall difference between the three call series. This test was highly significant (F=16.1; P<0.001). Equality of the means for each pair of call series was tested by a multivariate analogue to the "t" test, called Hotelling’s T-squared test. The results were the followings: 1) Grey heron versus Discussed id: P=0.2 that is not significant difference between means; 2) Grey heron versus Night heron: P<0.001 that is highly significant difference between means; 3) Night heron versus Discussed id: P<0.001 that is highly significant difference between means.
After MANOVA I have also performed Canonical Variate Analysis (CVA), as
a descriptive tool to evaluate how well linear combinations of the
selected acoustic features could separate calls according to the identity
of the singer. CVA produces a scatter plot of specimens along the
first two canonical axes, producing maximal and second to maximal
separation between all groups (multigroup discriminant analysis). The
axes are linear combinations of the original variables as in Principal
Component Analysis. In this case, the two variables with relative higher identification power (higher CVA "loading") are first harmonic frequency and duration of call.
Fig. 4 below shows the results of CVA, which yields a clear cut separation between Night heron calls and Grey heron calls, while the Discussed id calls are almost completely superimposed to Grey heron scatter plot.
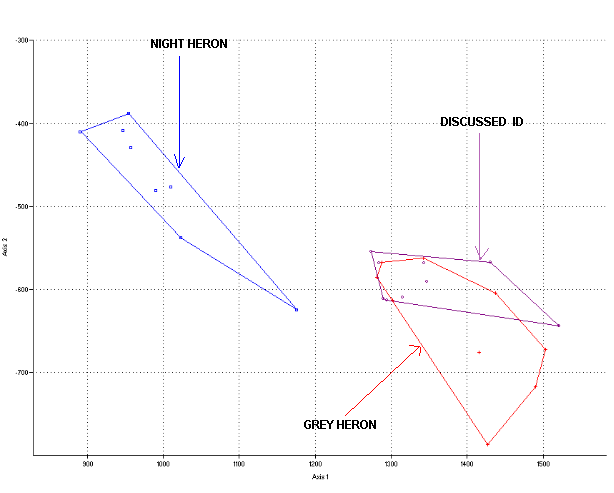 FIG. 4 - Scatter plot from Canonical Variate Analysis of the three call series.
For each call series I have also calculated the mean power spectrum. Power spectrum for each call was calculated with an FFT window of 512 points, sampling frequency 48 kHz, Hanning window type, over 400 ms of audio samples, each containing one whole call. The 400 ms audio samples were previously filtered with a bandpass filter from 0.5 to 6.5 kHz. Background noise and unwanted audio signals were removed too. The spectra for each call series were then averaged. The results are shown in Fig. 5, Fig. 6 and Fig. 7. A complex structure with several peaks is confirmed for Grey heron, with a dominant peak at 2.2 kHz and a lower peak at 1 kHz. Night heron call has a simpler structure that is shifted towards the lower frequencies, with a dominant peak at 1.7 kHz, while the first harmonic is barely visible between 0.5 and 1 kHz. Discussed id call is clearly more similar to Grey heron call, showing a multi-peak structure. Like Grey heron, the first peak is at 1 kHz and the second dominant peak is at 2 kHz.
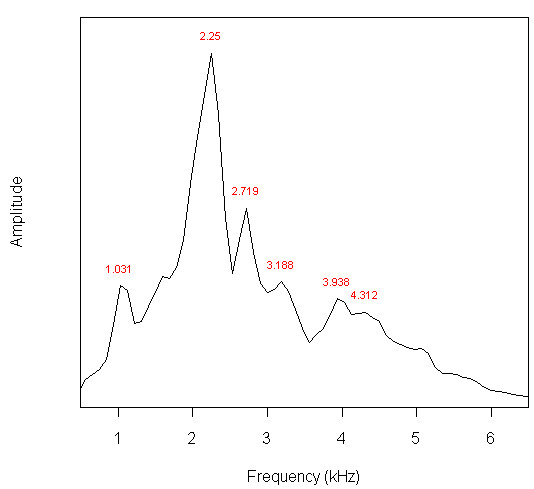 FIG. 5 - Average power spectrum of 9 Grey heron calls .
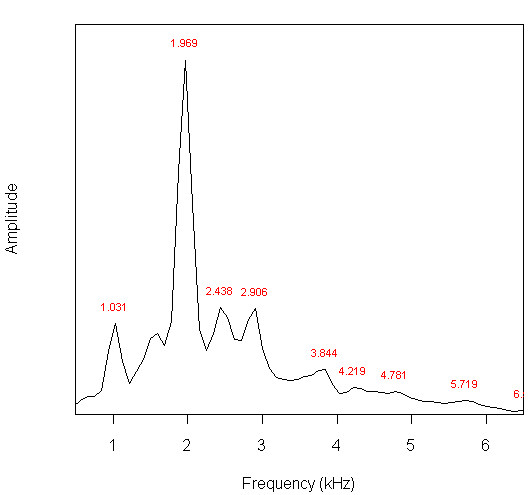 FIG. 6 - Average power spectrum of 9 Discussed id calls .
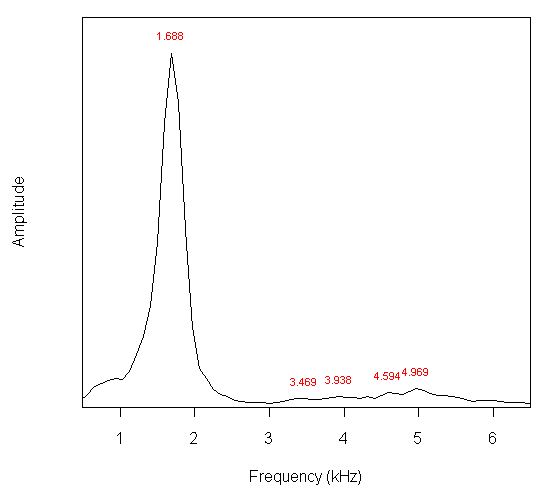 FIG. 7 - Average power spectrum of 8 Night heron calls .
Conclusion: the Discussed id call, listed on Xeno-canto as XC54113, is sure a Grey heron flight call. My previous attribution to Night heron was clearly a mistake.
Quantitative analysis of a small sample of Grey heron and Night heron flight calls revealed some differences. Night heron has lower dominant frequency, lower and less defined first peak. Call structure is less complex and shifted towards the lower end of the frequency spectrum. While Grey heron call has a more complex structure, with four or more harmonic components. The dominant peak is higher than for Night heron and the first harmonic, which shows a well-marked peak, is found at about 1 kHz.
However, these results are obtained with FLIGHT calls only. Therefore, probably they do not apply to other call types (say, calls from perched birds). Since the results reported here are obtained with small sample size, further research efforts are needed to investigate the vocal differences between these two heron species.
GROSSETO, 26 december 2010.


